Climate Deaths

Forecasting Climate Deaths
This work established a model of:
- CO2 emissions correlated with the UN 2024 population growth forecast
- incorporating scenarios for emissions reduction from 2030 to 2050 (Paris commitments), by 2060, by 2070 and continuing on the current reckless emissions trends
- global atmospheric CO2 concentration based on emissions net of natural drawdown (dissolving in oceans, photosynthetic, alkaline mineral weathering
- global mean surface temperatures (GMST) correlated with global atmospheric CO2 concentrations
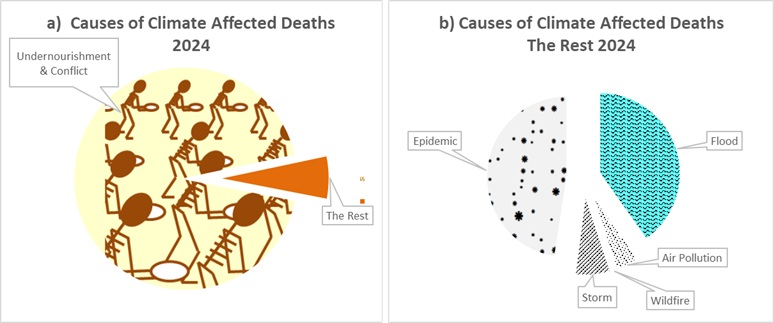
- Undernourishment and Conflict are considered inextricably linked so are modelled together. Starvation deaths are assumed at 1.2% (WFP Director) of those undernourished and combined with conflict deaths.
- For 20 different regions, the combined starvation and conflict deaths are iteratively separated into the reducing trend of deaths with time (development/prosperity) from the increasing trend with global atmospheric CO2 concentrations.
- For some regions, either their agriculture is not yet significantly climate affected or their populations are wealthy enough to afford imported food, masking climate vulnerability. For these regions latitude is used to extrapolate likely climate vulnerability.
- The economic growth and the distribution of incomes in each region are correlated with undernourishment to determine an income threshold below which people must rely on domestic food production and above which people can afford imported food to meet any shortfall in agricultural productivity. The proportion of population sufferring undernourishment and climate deaths is taken as the minimum of the proportion climate exposed and the proportion economically exposed multiplied by regional population.
- The sum of undernourishment and conflict deaths for each region provides the estimated globla forecast of undernourishment and climate deaths .
- Disaster numbers, from the EMDAT disaster database compiled since 1900, correlated with global atmospheric CO2 concentrations for:
- Drought
- Wildfire
- Storm
- Flood
- Mass Movement wet and dry
- Epidemic
[Earthquake, Volcanic activity and Drought investigated but excluded for lack of population normalised correlation]
- Climate caused disaster deaths as the product of disaster numbers and average deaths per disaster from the EMDAT disaster database
- Air Pollution deaths forecast at 20,000 per DegC of warming (Jacobson, 2008)
- Review of other available health related climate impacts revealed either lack of consensus between studies or lack of apparent climate correlation. Of 756 climate mortality causes in the WHO database, only 88 showed even a tentative increase with CO2 emissions, whilst 160 showed a decrease, hinting that overall climate change may reduce health deaths, but much more work is needed)
- Summing deaths per year
- Extrapolating all trends forward for all scenarios to 2300 and compiling cumulative deaths and cumulative emissions
- Determining the cumulative deaths per cumulative emissions ratio for each scenario and the 95% confidence limits on all of the forecasts.
There are some significant assumptions made in this modelling (detailed in the report) and large inherent variability and uncertainty in the results. It is envisaged that this modelling will be updated and refined periodically as climate change worsens and more data arises. This will improve confidence in the results and narrow the confidence limits.
| Metric | Scenarios | ||||
|---|---|---|---|---|---|
| Zero Emissions by: | |||||
| BAU | 2070 | 2060 | 2050 | ||
| Peak Climate Caused Deaths (Millions / year) | Low (yr) | 313 | 10 | 7 | 6 |
| (2257) | (2055) | (2043) | (2043) | ||
| Mean (yr) | 373 | 24 | 19 | 16 | |
| (2255) | (2047) | (2045) | (2035) | ||
| High (yr) | 184 | 72 | 60 | 52 | |
| (2253) | (2045) | (2042) | (2039) | ||
| Cumulative Climate Caused Deaths (Millions) by 2300 since 1900 | Low (yr) | 6159 | 1194 | 994 | 867 |
| Mean (yr) | 6124 | 2081 | 1798 | 1610 | |
| High (yr) | 6463 | 3562 | 3197 | 2901 | |
| Cumulative CO2 Emissions by 2300 since 1900 (Gt CO2-e) | Low (yr) | 8577 | 2352 | 2188 | 2070 |
| Mean (yr) | 9264 | 2612 | 2447 | 2328 | |
| High (yr) | 9494 | 2860 | 2696 | 2579 | |
| Cumulative Climate Caused Deaths per Cumulative Mt of CO2 emissions | Low (yr) | 790 | 507 | 454 | 419 |
| Mean (yr) | 806 | 797 | 735 | 692 | |
| High (yr) | 960 | 1245 | 1186 | 1125 | |
These deaths will most be caused by starvation and conflict:
Clarity Environment can provide advice on the climate deaths attributable to any product, service, investment or government or corporate policy for which the carbon or CO2-e emissions can be estimated. We will provide this advice pro-bono to environmental advocacy organisations attempting to hold governments, corporations or investors to account for their true climate liabilities.
Services
Environmental Policy
Extensive experience in technical, advocacy, business, and policy in UK, US and Australia, a global leader in Climate, Energy, and Life Cycle Assessment.
Life Cycle Assessment
Life Cycle Environmental Impact Assessment potentially the most comprehensive method for assessing environmental impacts.
Life Cycle Based Building Design
Discover the complex interactions and perverse outcomes arising from design decisions affecting climate, environmental impacts, capital and Life Cycle Costs.
Process and product evaluation
Clarity Environment can assist manufacturers to understand and reduce the true climate and environmental impacts of their processes and supply chains.
Ecolabelling/Environmental Product Declaration
Clarity Environment helped develop National Standards for Ecolabels and EPDs, ensuring technical robustness and efficiency.
Transport Impacts
Understand the transport impacts of buildings and location and the strategic benefits of electric vehicles with bi-directional charging, transforming Australia’s grid and enabling 100% renewable power.
Climate Deaths
Climate impacts are killing people. Discover the climate mortality liabilities of your government or corporate policies, investments or lifestyle choices.